

Our Site Selection Process

How to choose a tower site?
Maryland's geography is challenging. The state has a surface area of 12,400 square miles, a perimeter of 842 miles, and about 3,000 miles of tidal shoreline. The landscape is complex: the Allegheny and Blue Ridge mountains in the west, the Piedmont Plateau in the center, the Atlantic Coastal Plain in the east, and the Chesapeake Bay. To resolve this challenging geography and weather conditions, a mesonet will require many observing sites; 75 meteorological stations are planned.Identifying optimal observing sites is also challenging; a two-phase identification procedure is used. In the first observations-based phase, extreme weather statistics and demographic data are used to identify one-third of the sites. Populated regions exposed to frequent extreme precipitation were identified from analysis of extreme precipitation (total daily precipitation equaling/exceeding 2 inches/day) events in the recent 30-year period (1991-2020) and the 2016-2020 zip-code level population. Phase-1 analysis was constrained to yield at least one Mesonet station in each Maryland county and Baltimore City.
In Phase 2, numerical weather forecasts for previous extreme events (also called hindcasts) will be deployed to identify regions within the state that are particularly influential on statewide forecasts. About two-thirds of the proposed 75 stations will be chosen using this methodology.
DOING THE MATH
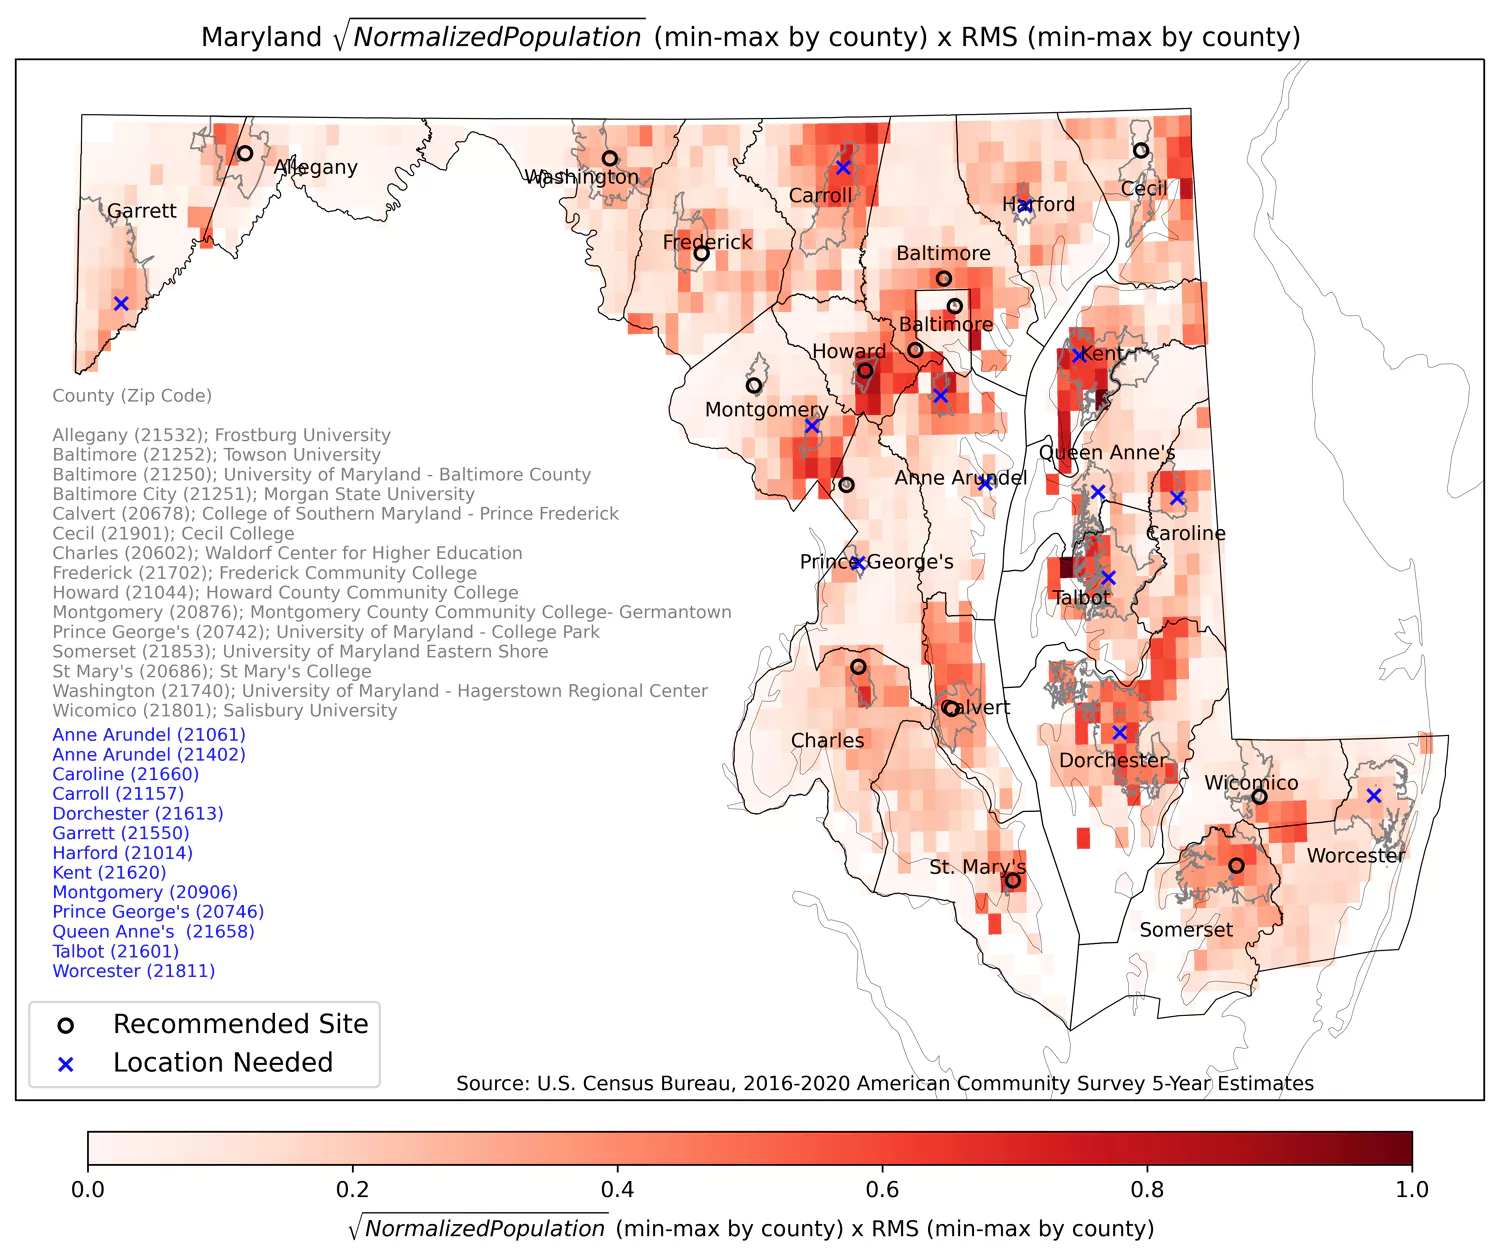
In practice, that led to siting recommendations based on the following calculations and steps:1) Extreme Daily Precipitation Intensity in the recent 30-year period (1991-2020): Root-Mean-Square (RMS) of daily total precipitation exceedances (greater than or equal to 2 inches) in each season are averaged after weighting them by seasonal exceedance counts.
2) Extreme Daily Precipitation Frequency:
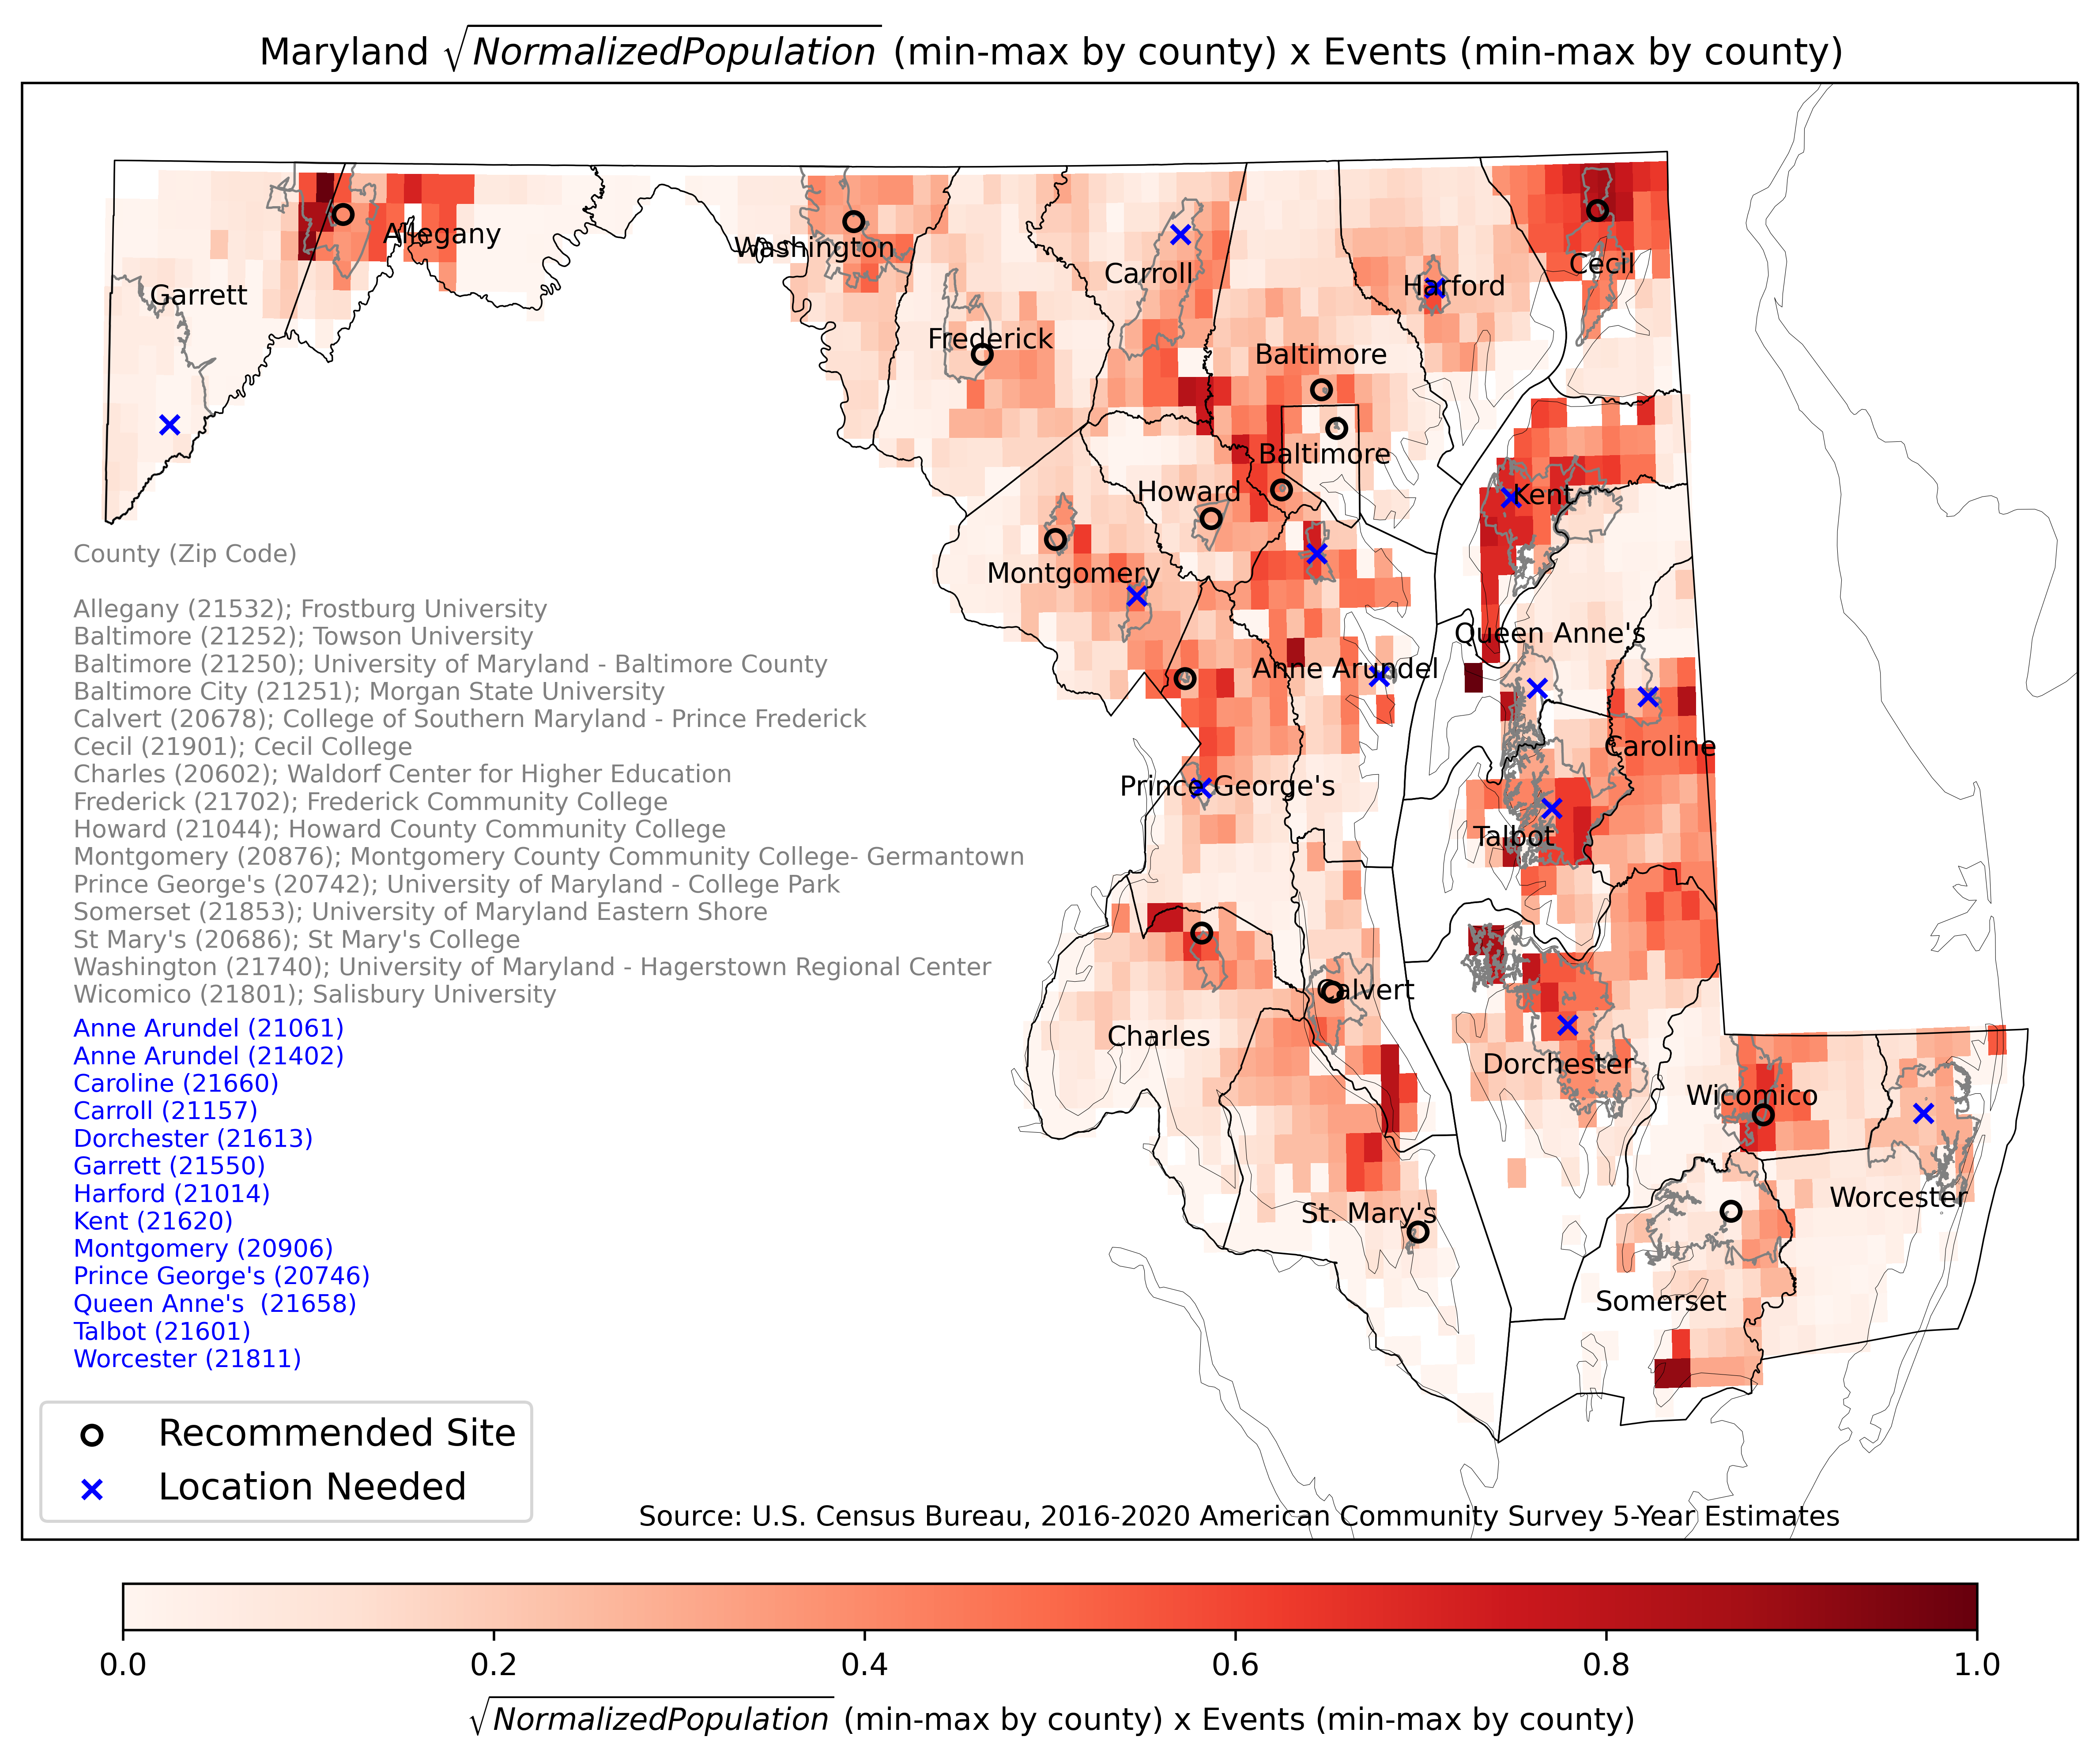
Annual count of days with daily total precipitation of at least 2 inches.
3) Population-based Impact Potential:
As the impact of extreme daily precipitation is larger in more densely populated areas, the extreme precipitation statistics are weighted by the square root of population density (the square root is preferred because it leads to smoother weights).
4) Within-County Recommendations:
These were based on county-level min-max scaling of each variable as given by the formula: X_scaled = [(X - Xmin) / (Xmax - Xmin)]
5) Siting Recommendation:
Based on i) maps of scaled extreme daily precipitation intensity, and ii) scaled frequency of extreme daily precipitation.
(Maps available below)
County-level Scaled (Population Density) ½ times County-level
Scaled Precipitation Intensity
 [hover to zoom]
[hover to zoom]
County-level Scaled (Population Density) ½ times County-level
Scaled Precipitation Occurrence
 [hover to zoom]
[hover to zoom]
Data sets for our analysis included:
Precipitation: NOAA's NCEI nClimGrid-Daily 5-km climate gridded fields for the contiguous United States (1991-2020)
Demographics: 2016-2020 American Community Survey 5-year estimates by ZCTA; zip-code population is divided by zip-code area, and the resulting density is interpolated to the 5-km precipitation grid.